Relative abundance of C2/C3/CN in comet C/2022E3 ZTF

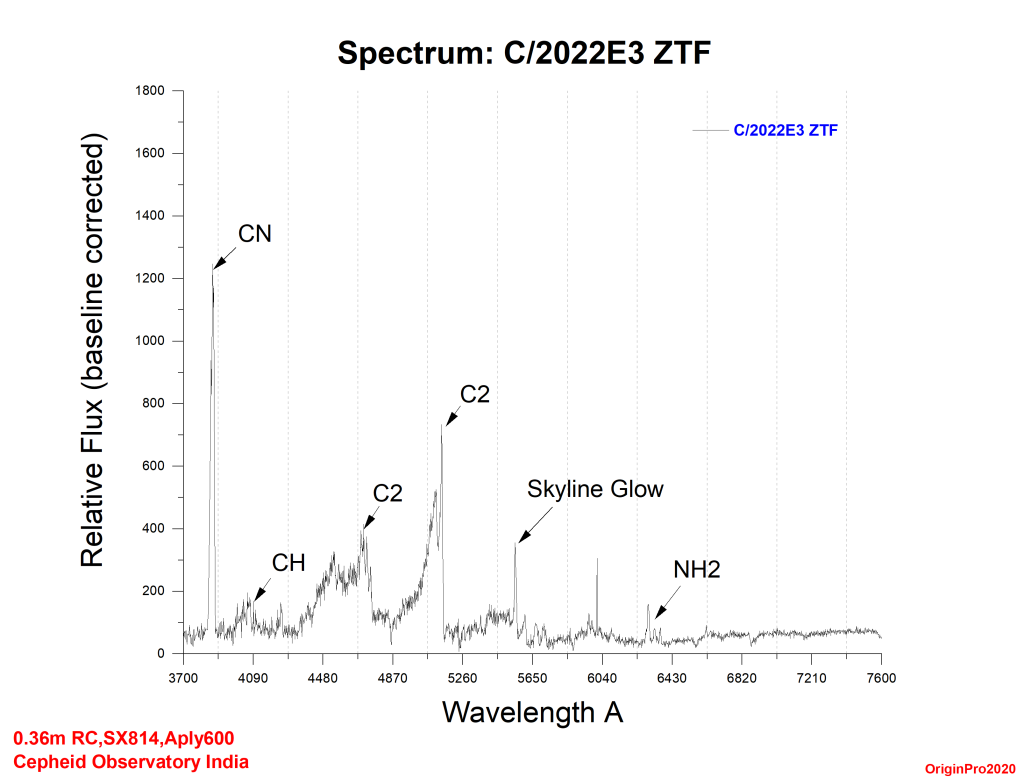
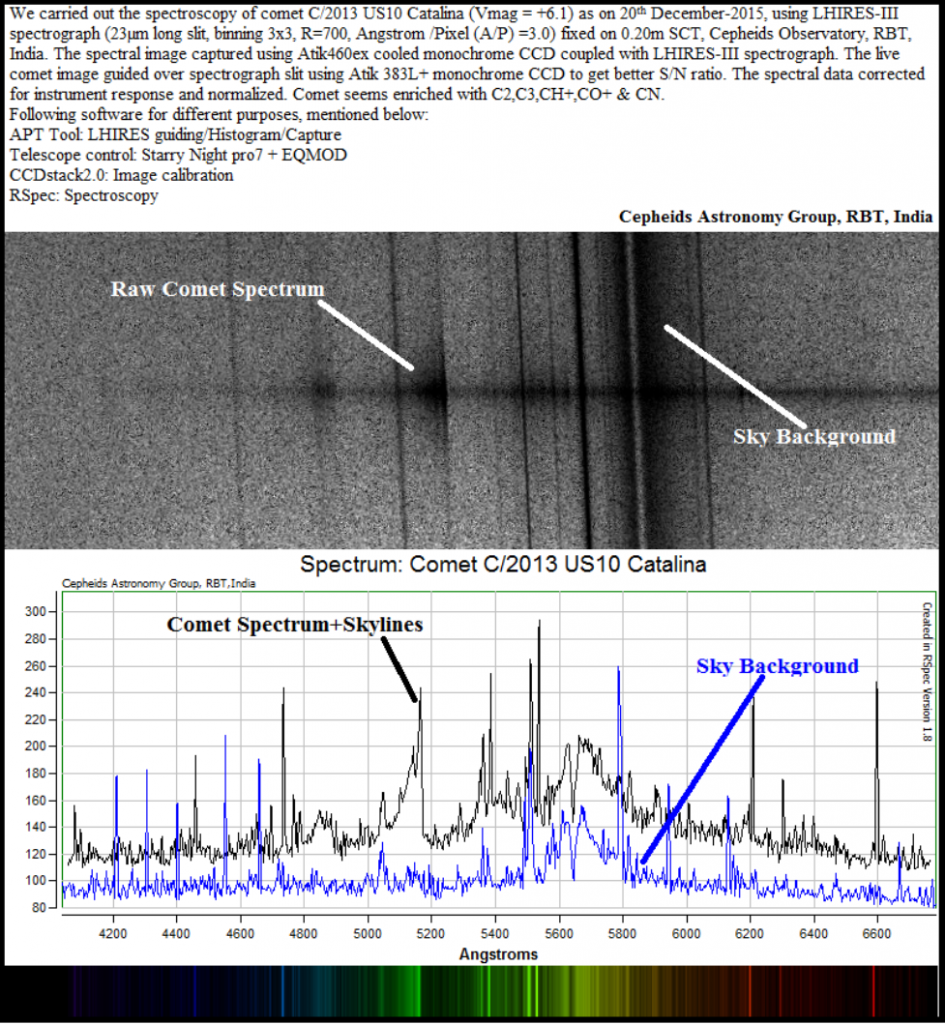
We carried out the spectroscopy of comet C/2022E3 ZTF (V mag = +5.7) as on 28th January-2023, using Aply600 spectrograph (23µm long slit, R=700, Angstrom /Pixel (A/P) =1.9) fixed on 0.36m RC. The spectral image captured using SX814 cooled monochrome CCD coupled with Aply600 spectrograph. The image guided over spectrograph slit using Atik 414 monochrome CCD to get better S/N ratio. Comet seems enriched with C2,CH+,NH2 & CN.

The spectral data corrected for instrument response and baseline corrected. We used RSpec and OriginPro2020 for data analysis.

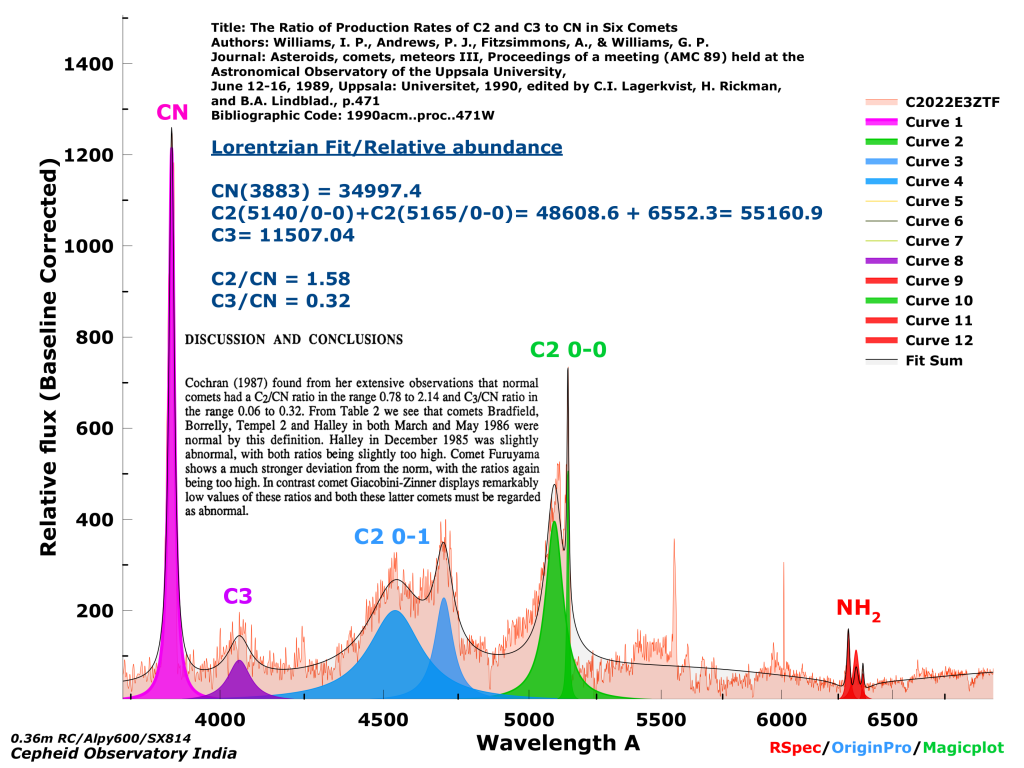
We tried to estimate the relative abundance of C2/C3/CN in comet C/2022E3 ZTF using Lorentz fitting. The area of respective peaks are calculated for C2/C3/CN, We find the results as follows. Figure attached.

Lorentzian Fit/Relative abundance

CN(3883) = 34997.4
C2(5140/0-0)+C2(5165/0-0)= 48608.6 + 6552.3= 55160.9
C3= 11507.04

C2/CN = 1.58
C3/CN = 0.32

The link of supported document / paper is given below.

Title: The Ratio of Production Rates of C2 and C3 to CN in Six Comets
Authors: Williams, I. P., Andrews, P. J., Fitzsimmons, A., & Williams, G. P.
Journal: Asteroids, comets, meteors III, Proceedings of a meeting (AMC 89) held at the
Astronomical Observatory of the Uppsala University,
June 12-16, 1989, Uppsala: Universitet, 1990, edited by C.I. Lagerkvist, H. Rickman,
and B.A. Lindblad., p.471
Bibliographic Code: 1990acm..proc..471W

Spectrum: C/2022E3 ZTF

We carried out the spectroscopy of comeC/2022E3 ZTF (Vmag = +5.7) as on 28th January-2023, using Aplt600 spectrograph (23µm long slit, R=700, Angstrom /Pixel (A/P) =1.9) fixed on 0.36m RC. The spectral image captured using SX814 cooled monochrome CCD coupled with Aply600 spectrograph. The image guided over spectrograph slit using Atik 414 monochrome CCD to get better S/N ratio. Comet seems enriched with C2,CH+,NH2 & CN.
The spectral data corrected for instrument response and baseline corrected. We used RSpec and OriginPro2020 for data analysis.
Cepheids Observatory India

Spectrum: Comet ISON

The spectrum below of the comet ISON shows how easy it is for amateurs to study astronomical spectra. This wonderful spectrum of ISON using a just an 80 mm refractor, simple Star Analyser grating, and a DSLR. It clearly shows the green glow from glowing Carbon (the so-called “Swan bands” – Wikipedia link) This image was captured from a rooftop in Rajasthan, and then processed in the RSpec software.

Comet C/2013 X1 PanSTARRS

We carried out the spectroscopy of Comet C/2013 X1 PanSTARRS (Vmag = +9.67) as on 2016.01.09, using LHIRES-III spectrograph (23µm long slit, R=700, Angstrom /Pixel (A/P) =3.0) fixed on 0.20m SCT. The spectral image captured using Atik460ex cooled monochrome CCD coupled with LHIRES-III spectrograph. The image guided over spectrograph slit using Atik 383L+ monochrome CCD to get better S/N ratio. Comet seems enriched with C2,C2,CH+ & CN.
The spectral data corrected for instrument response and normalized. We used following software for different purposes.
APT Tool: LHIRES guiding/Histogram/Capture
Telescope control: Starry Night pro7 + EQMOD
CCDstack2.0: Image calibration
RSpec: Spectroscopy
Cepheids Astronomy Group, RBT, India.

Comet C/2013 US10 Catalina

We carried out the spectroscopy of comet C/2013 US10 Catalina (Vmag = +6.1) as on 20th December-2015, using LHIRES-III spectrograph (23µm long slit, R=700, Angstrom /Pixel (A/P) =3.0) fixed on 0.20m SCT. The spectral image captured using Atik460ex cooled monochrome CCD coupled with LHIRES-III spectrograph. The image guided over spectrograph slit using Atik 383L+ monochrome CCD to get better S/N ratio. Comet seems enriched with C2,C2,CH+,CO+ & CN.
The spectral data corrected for instrument response and normalized. We used following software for different purposes.
APT Tool: LHIRES guiding/Histogram/Capture
Telescope control: Starry Night pro7 + EQMOD
CCDstack2.0: Image calibration
RSpec: Spectroscopy
Cepheids Astronomy Group, RBT, India.