Emulating Our Parent Star: Solar eruptions and their Geo-effectiveness

Dr. Shirsh Lata Soni worked in solar and space physics, APS University, MP, India. Here in this blog, she explains and light on the solar explosion and their geo-effectiveness.

She says:

We have been taught from childhood that the Sun is our parent star and it is a fireball with millions of Kelvin temperature. The Sun loses about 4 million tons of mass in the form of energy during nuclear fusion and about 1.5 million tons of mass each second, in the form of solar wind and other eruptions. However, the Sun has lost less than 0.1 percent of its mass since it was formed, 4.5 billion years ago.

The Sun emits energy in a huge range of electromagnetic waves: from X-rays (solar flares) to radio waves (solar radio bursts). Thus, it is difficult to study the energy emitted from the sun in any one fixed band. Most extensively explosive phenomena on Sun are known as Coronal Mass Ejection (CME). One of the most important reasons to study CMEs is that they are amongst the major drivers of what is known as space weather – a series of phenomena, disturbances, and technical failures that are caused by solar events Figure 1.


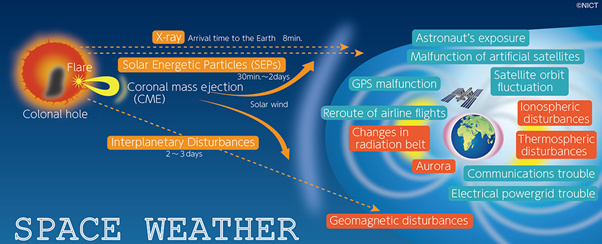
Figure 1. Examples of ways in which space weather can affect Earth and its infrastructure. Image courtesy: Space Weather Forecast Centre, Japan

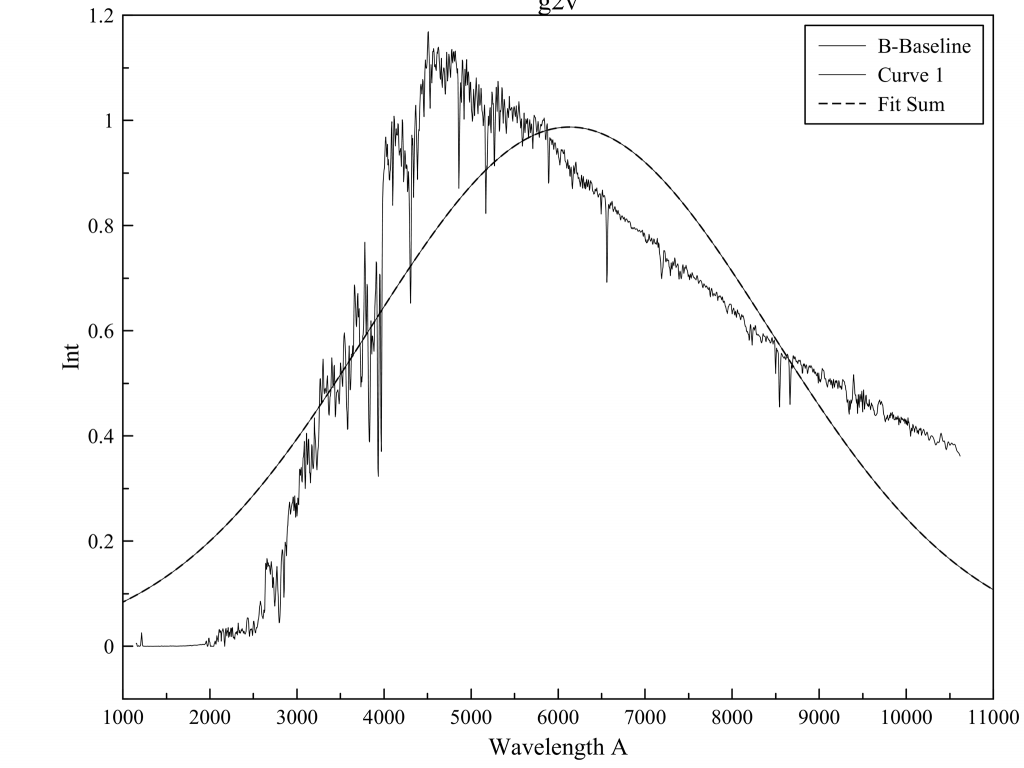
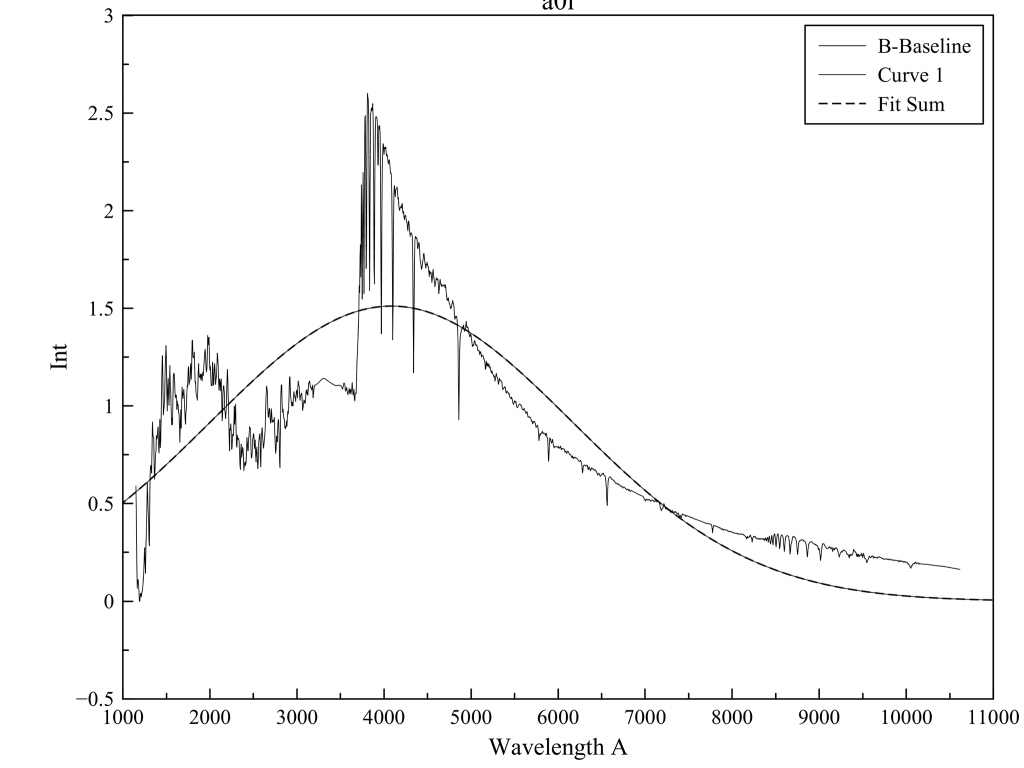
CMEs are huge and spectacular clouds of magnetic field and plasma that regularly erupt from the Sun and propagate throughout the interplanetary medium. Forecasting CMEs and their impact on Earth, however, is not as straightforward as it may seem. Firstly, as each CME is characterised by its own latitudinal and longitudinal extent, it is important to determine whether a CME will impact Earth at all (which is known as the hit/miss problem). Coronal mass ejections (CMEs) that appear to surround the occulting disk of the observing coronagraphs in skyplane projection are known as halo CMEs (Howard et al., 1982). Halo CMEs are fast and wide on the average and are associated with flares of greater X-ray importance because only energetic CMEs expand rapidly to appear above the occulting disk early in the event. Halos with their sources within ±45◦ of the central meridian are known as disk halos, while those with a central meridian distance (CMD) beyond ±45◦ but not beyond ±90◦ are known as limb halos, See Figure 2 and Figure 3.

Figure 2: These solar disks show the selected active region passes through the central meridian of the heliographic disk. In the first column we shown solar disk in 94 Å band and in the second column in the figure we choose the continuum image of the solar disk (a) Shows the first Active period with the three most active region AR 11875, AR 11877, and AR 11882 dated 23/10/2013, 24/10/2013, and 30/10/2013 respectively. (b) Shows the first Active period with the three most active region AR 11884, AR 11890 dated 02/11/2013, and 04/11/2013 respectively. (c) Shows the first Active period with three most active region AR 12192, AR 12201, and AR 12205 dated 23/10/2014, 04/11/2014, and 10/11/2014 respectively.
Figure 3: GOES X-ray plots in two wavelength bands (red) 1-8 A and (green) 0.5-4 A for duration 22-29 Oct 2013 (a), period 01-08 Nov 2013 (b), and third period 25Oct-08Nov 2014 (c). The circle indicates the X-class flares.

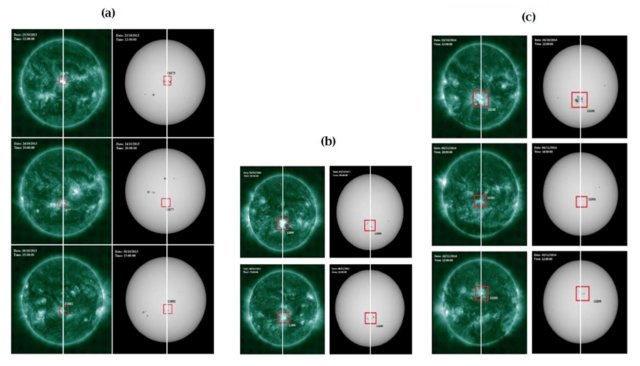
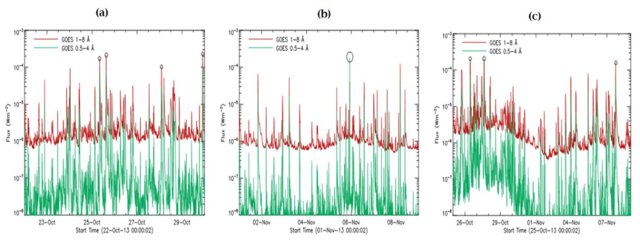
Disk halos are likely to arrive at Earth and cause geomagnetic storms, while limb halos only impact Earth with their flanks and hence are less geoeffective. Secondly, every CME has its own initial speed that will change by the time it reaches Earth because of interactions with the local solar wind speed (which is known as the arrival time problem). In the interplanetary medium, the CME went through acceleration and deceleration due to solar wind speed and finally come to speed nearly equal to speed of solar wind. But as we know that the speed of solar wind shows variation during the 11 year period of solar cycle. Finally, the direction of the magnetic fields within a CME plays an important role in driving space weather effects at Earth – the most geoeffective structures are those that are pointing southward of the ecliptic plane, because they interact the most with Earth’s intrinsic magnetic field, opening it to dangerous particles and radiation. This problem is known as the BZ problem (where Z indicates the north–south component).

The problems related to space weather forecasting of CMEs are not over yet! When CMEs are detected in situ, they are often accompanied by so-called interplanetary shocks ahead of them. The region of shocked and compressed solar wind that lies between a shock and an ICME ejecta (flux-rope or not) is known as the sheath region. Sheath regions can be powerful drivers of geomagnetic storms themselves, but they are (if possible) even more challenging to forecast than CMEs, especially because of their turbulent and variable nature.

A large part of my PhD studies has been centred on determining the features of early evolution of CMEs from its eruption site on solar atmosphere (active regions). Thesis includes comprehensive investigations of propagation characteristics of coronal mass ejections (CMEs)  in the solar corona and interplanetary medium along with explorations of solar source regions of CMEs and flares with their interplanetary consequences and geo effectiveness. For this purpose, I carried out an analysis of multiwavelength, multi-instrument, multi-point observations of solar activity as well as interplanetary observations with the help of data obtained from space and Earth-based instruments as well. It is clear that many questions are still open in CME research and forecasting, but I am positive that the next few years will be filled with exciting new discoveries (especially with the recently launched NASA’s Parker Solar Probe spacecraft and the future  ISRO’s Aditya L1 and ESA’s Solar Orbiter mission). Below you can find my doctoral dissertation and its included publications:

Find more about her work at:

https://shodhganga.inflibnet.ac.in/handle/10603/303830

https://www.researchgate.net/profile/Shirsh-Soni

Dr. Shirsh Lata Soni

Dr. Shirsh Lata Soni, Research Scholar (Astronomy and Solar terrestrial Physics) SAS-10 CSSTEAP (UN Course / ISRO) A.P.S. University Rewa, MP, India 

How much far! How much close! a C11 SCT is?

We examined a random star field near to galactic band using Exoplanet Blue Blocking filter (The spectrum of the Astrodon ExoPlanet-BB filter is shown Below). It blocks UV and blue light.  It starts transmitting light near 500 nm, corresponding to the shape of the conventional V-band filter and continues to transmit light into the near-infrared.

The purpose of using this filter was to achieve the best possible focus at red end. The 40 sub frames of 120 seconds were taken using PRiSMv10. The image stacked and photometrically calibrated using star catalog ATLAS and Tycho8.0. We achieved the best possible average magnitudes at V band (conversion) to +21.50

Image:
Object: Random Star Field
DATE-OBS: 2021-04-18T21:28:25
EXPTIME(Seconds): *B/*V/*R/*I/*g’2/*r’2/*i’2/*z’2/4800ExBB
SUBFRMS: *B/*V/*R/*I/*g’2/*r’2/*i’2/*z’2/40ExBB
OBJCTRA: 18 19 30.15
OBJCTDEC: +09 28 07.1
Instrument:
Astrometry Catalog: ATLAS: Y, UCAC4: N, GAIAEDR3: N
Photometry Catalog: : UCAC4: N, APASS: N, ATLAS: Y
Johnson/Bessel: (B): *.*, (V): *.*, (R): *.*, (I): *.*
Sloan: g’2: *.*, r2: *.*, i’2: *.*, z’2: *.*
CCD: ATIK-383L+
FILTERS:
Sloan: u’2: N,g’2: N,r’2: N,i’2: N,z’2: N, ExBB: Y
Johnson/Bessel: U: N,B: N,V: N,R: N,I: N,
TELESCOPE: C11, 1623.0mm
PRiSMv10, Tycho8.0
Site:
ORIGIN: Cepheid Observatory, India, Vorion Scientific, India
SITELAT: +24:55:00:00
SITELONG:+75:33:58:99
Observers:
K.V
Measures:
S.M, B.K, V.A.
Remark:
Sky Clear, 
End

Random Star Field (Star Spikes are artifact only to make image interesting)
Original FITS
Astrodon Exoplanet BB Filter

Space Rock: Apophis

Apophis is 1,120 feet (340-meter-wide) wide and made of rock, iron and nickel. It is probably shaped roughly like a peanut, though astronomers will have a better idea of its form when it passes by Earth this week, according to NASA.

The asteroid takes a full orbit around the sun about every 11 months. On March 5, it will come within 10,471,577 miles (16,852,369 km) of Earth at 8:15 p.m. EST (0115 GMT on March 6). That’s too far to be seen with the naked eye, but scientists will use planetary radar to image Apophis as it flies by using NASA’s Goldstone Deep Space Communications Complex in California and the Green Bank Telescope in West Virginia. They hope to determine the asteroid’s shape and learn more about the way it rotates. 

“We know Apophis is in a very complicated spin state, it’s sort of spinning and tumbling at the same time,” Richard Binzel, a planetary scientist at the Massachusetts Institute of Technology, told Space.com.

Apophis

Instrument:
Catalog: MPC
Bessell (B): +*.*Bessell (V): +*.*
Bessell (R): +15.2, Bessell (I): +*.*
CCD: ATIK-383L+
FILTERS: R
TELESCOPE: C11, 1623.0mm
PRiSMv10, Astrometrica
Site:
ORIGIN: Cepheid Observatory, India, Vorion Scientific, India
SITELAT: +24:55:00:00
SITELONG:+75:33:58:99
Observers:
V.K.Agnihotri, B. Kumar, S. Mahawar, K.Vora
Remark:
Sky Clear.
End

https://www.youtube.com/watch?v=gjS0c1mHAuU

Optical part of gravitational lens system, QSO 0957+561

QSO 0957+561 is first discovered gravitational lens system by Walsh, Carswell, & Weymann in 1979. The quasar QSO 0957+561 appears twin (QSO 0957+561A and QSO 0957+561B) due to gravitational lensing by host galaxy YGKOW G1 that is located directly between Earth and the quasar. The expected distance of QSO 0957+561 from earth is around 9.0 billion Ly.

The photometric analysis of such lensed quasars a like QSO 0957+561 are studied to estimate the more accurate value of Hubble constant. Two images are photometrically examined for long time to estimate the time delay which is proportional to difference between distances travelled by to twin counterparts and mass lens model (which depends on host galaxy). The time delay approach is independent of both methods, like plank ΛCDM (Lambda cold dark matter) or Lambda-CDM model flat results and distance ladder + Type Ia SNe results, which are previously used to estimate Hubble constant (for more watch video link added below).

For more reading:

https://wwwmpa.mpa-garching.mpg.de/~komatsu/meetings/ds2013/schedule/suyu_desitterii.pdf

https://iopscience.iop.org/article/10.1086/320462/pdf

We imaged the QSO 0957+561A and QSO 0957+561B. An astrometric reduction of two optical centers of twin quasars in FITS image estimates the separation of 6 arc second due to gravitational lensing by host galaxy. We used photometric R band filter as expecting that redder part of optical spectrum should be more dominated due to high redshift z=1.4.

Instrument:
Catalog: SIMBAD
Bessell (B): +*.*Bessell (V): +*.*
Bessell (R): +16.4, Bessell (I): +*.*
CCD: ATIK-383L+
FILTERS: R
TELESCOPE: C11, 1623.0mm
PRiSMv10, Astrometrica
Site:
ORIGIN: Cepheid Observatory, India, Vorion Scientific, India
SITELAT: +24:55:00:00
SITELONG:+75:33:58:99
Observers:
V.K.Agnihotri, B. Kumar, S. Mahawar, K.Vora
Remark:
Sky Clear.
End

Cosmology with Time Delay Strong Lensing by Kenneth Wong

https://www.youtube.com/watch?v=YECujbmyTMo

46P / Wirtanen – Parallax removal

The students of astronomy group of the language and high school in Bruneck, South Tyrol, estimated the distance of comet 46P using parallax method. We have pride to be part of this campaign. The project was completed by Christof Wiedemair and his students Vera Oberhauser, Lisa Niederbrunner, Pauline Hofer, Dominik, Maximilian and David.

Read: http://astrocusanus.blogspot.com/2018/12/46pwirtanen-entfernung-mittels-parallaxe.html

Few memorable pics!

Image 1: The Wirtanen parallax team!

From left: Vikrant Agnihotri, Vera Oberhauser, Lisa Niederbrunner, Pauline Hofer and Sebastian Voltmer.
Image 2: Screenshot of Vikrant’s computer screen on the evening of the data acquisition. For motivation or to stay awake, he faded in a group photo of the “Team Bruneck” that we had sent him shortly before!
Image 3: From left: Dominik, Maximilian and David evaluating the collected data!

Birth and Death of a Star

Birth and Death of a Star: We do not know from where to start, ice to fire or fire to ice. Keeping mind cool let us start from ice age. The cycle of birth, aging, death and rebirth of stars dominates in every galaxy, generates new elements, produces spectacular explosions called supernova and leaves “cinders, the remnants of stars behind it, which further no usually participate in cycle, called white dwarf, neutron stars, and black holes. Stars form in molecular clouds and die when they burn their fuel. Small stars end with white dwarf and large stars explode as supernova and leave neutron star and black hole behind it. In these cases, stars are supported against gravity by purely quantum effect as at the end of fuel cycle there is no outward pressure in star to hold the gravity and keep star in a particular size. First it should be known that molecular clouds are not stars because those don’t behave like black body. The clouds are so rarefied, have very low temperature and expanded up to large space. These clouds are usually made of hydrogen, carbon mono oxide and formaldehyde. The molecular clouds emit microwave radiation and keep going cool down but clouds are opaque to visible frequency range. If it so the gravity kick inward puss and the wide span cloud started shrinking, but generally we do not see it and these dust and gas cloud still hold its shape against gravity (The Eagle nebula, M16, is one its example). Now question is that, what is the extra source of energy to compensate the loss in energy by microwave radiation? The answer is cosmic energy by the near by star. Once the dense part of molecular cloud start to contract, the star birth starts gets underway. This contracting gas is called “proto star”. The minimum size of a cloud to become a proto star is called “Jeans length”. How to get that length? Very easy, equal the average kinetic energy of gas with the gravitational potential energy, so (3KT/2=GMm/R).This calculation is little wrong as the molecules on the surface leave during the process of contraction even having low velocity. The more correct calculation involved diffusion mechanism in cloud to estimate correct Jeans length. As proto star forms, slowly it gets dense and started to trap radiation and begin to behave like black body. At this point temperature rise sharply and it begins shine. Once the star forms, it will live in steady fashion for a very long time. We can not understand the death of a star until we know the mechanism of its life cycle. Here gravity works like thermostat. If at some time, suppose thermonuclear reaction gets fast, it will cause swell in the central core of star. The extra energy in terms of photon movement comes out. This reduces the temperature and density in the central core and reducing the rate of reaction. In opposite, when the central cores has less temperature and density, the gravity switch on the reaction rate by contracting the whole star and keep the fusion on.

Class of Nebulosity

Class of Nebulosity: What are the nebula? The answer is very simple in first sight that it is glowing gas and dust of a dead stars, which is either re-excitation of gas by the radiation of near by star or reflection of electromagnetic wave by its dust. But really they are rebirth places of new stars and most fascinating state of matter like neutron stars and black holes. We will discuss those bodies in next article where we will talk about the high temperature state of matter with tremendous gravitational force acting on those systems. But here it is limited only up to class of nebulas. The Galactic Nebula divided into two classes Diffused Nebula (irregular)Planetary Nebula (Regular & Emission)The Diffused Nebula again divided into two classes Dark Nebula Luminous Nebula The Luminous Nebula again divided into two classes Reflection Nebula Emission Nebula The Emission Nebula again divided into two classes Super Nova Remnants Normal H II Regions So the question still remains what is behind the distribution of gas and dust in regular or irregular shape. The answer is nova out burst. As we know that the tremendous gravitational force keeps the nuclear chain reaction on in the stars. In the fusion, hydrogen nuclei get converted in helium and other isotopes. The production of these isotopes increases the internal pressure of star and when it reaches to the critical mass where gravitational force and this outward pressure balanced, and the out burst condition become ready and star burst. This is called super nova explosion. And exploded star becomes different class of nebulae as mentioned above. If the parent star is of O / B0 class (Sorry it will be covered in other section), then the radiation from the star is so energetic that it ionizes all portion of gas and dust. This gas further emit the spectral lines fully different from the parent star is known as “gas bounded” nebula. On the other hand if the radiation emits by the near by star is no so energetic, then the all radiation just reflect by the nebular gas and dust and this gas and dust portion is called “radiation dominant” nebula. In radiation dominant nebula the spectral lines are same as of the parent star. Now let us talk about the gas bounded nebula. If gas is in regular shape like oval or circle after burst of parent star and further gas is re excited by the central residual part of parent star (also known as white dwarf) is called planetary nebula. The famous examples are NGC 7393(Helix Nebula) and M57 (Ring Nebula).The nebula which are far far beyond the reach of near by star are called dark nebula. The great rift part of our Milky way galaxy is believed to be home of dark nebula. The Horse-head nebula, IC434 are best examples. On the other hand lagoon nebula and Great Orion nebula are best examples of the emission nebula. If there is a star of spectral class above B1, then there will be emission nebula associated with it. It will ionize all hydrogen beyond Lyman head. These region are called H II or H beta regions, whereas neutral hydrogen is being called as H I region or H alpha region. The H II region is surrounded by H I region. These nebula are called emission nebula. The star below B1 class are poor producers of energetic radiation and failed to activate the gas and dust and only reflection effect will come into picture and so nebula is called reflection nebula. The M45, Pleiades is best example of reflection nebula. All emission and reflection nebulae are radiation dominant. No gas dominant diffused nebula found yet.

Spectral Class of Stars

Spectral Class of Stars: When an astronomer looks the sky, some basic questions should come in his mind. They are as follows:1. How stars do come into existence? What is their life?2. How stars maintain stock of energy?3. What happens to the energy radiated in to space?4. What is ultimate fate of universe?The life of a star is of million and million years with respect to our life of maximum hundred years, so how can we judge the whole life of a star in our life span. It is not better to observe the single star continuously over your life time, rather observe a huge set of stars and study their spectral class. The first impression and physical variable which come in picture is the color of star. In the world of modern physics, we know that it is a function of temperature (a black body radiation; λ * T = 2.8978×10⁻³ m⋅K) but it was very difficult to understand for our past heroes (Physicist and scientists) that color emitted by a star is basically a temperature effect and slowly all explanations goes in pocket of quantum mechanics.That was genius of Sir Joseph Fraunhofer who invented first spectrograph and Sir Norman Lockyer who told the temperature dependence of colors emitted by stars followed by Kirchhoff and Bunsen. The very first star examined, no doubt was our Sun, a gigantic burning amount of gas. Fraunhofer observed the dark lines in the spectrum but do not have explanation, until Kirchhoff came with theory that a very hot object emits all frequency of radiation and same get absorbed by the same element which emits it. The very interesting thing is that Kirchhoff did not know the model of atom and their quantum energy levels still very close to quantum mechanics.In the earlier age of astrophysics the stellar spectra was a riddle and the explanation of Lockyer was out of rule of physics i.e. he argued that the temperature of chromospheres of sun increases outwards and atom get stimulus and feels some kind of enhancement, which finally not known to the Lockyer. Lockyer also not explained why the heavy atoms resides on the upper surface of chromospheres like Ca and Na (Is gravity goes to holidays) and Why Sun’s stellar spectra dose not shows the absorption lines of different elements. Finally M.N.Saha came with answer for all unanswered question. Here, it is important about the sun that that was the very first star which was examined by the Astrophysicists. For the information point of view sun has different regions of activation like central core where hydrogen fusion take place due to enormous gravity, then photosphere, chromospheres, prominences, sunspots and spicules.Now come to point. Saha objected that rise in temperature outwards to any star is out of physics rule. But he was much aware about the statement of Lockyer. Lockyer told that atom gets stimulus and Saha argued that Lockyer was not fully incorrect. The atom suffers the combine effect of the temperature and pressure at that location as well as ionization potential of atom. Saha came up with his ionization theory which explained all is well.As per Saha’s theory, the degree of ionization of any gas depends on temperature, pressure and I.P. which Lockyer missed. You can get this formula in any book of Astrophysics. Basically, star gas always remains in the thermal equilibrium with its ion and electron pair. The gas ionized as per its I.P. and temperature and further recombined due to pressure.Now see and example, I.P. of calcium is 6.0 eV. The temperature inside the chromospheres is 7500 K and pressure is 1 atm. For this condition only 33% calcium atoms get excited. But at outer surface of chromospheres temperature is 6000 K and pressure is 0.0001 atm. In this case ionization is 95% of original neutral calcium atoms. So the finally ionization of any element in star is function of three parameters i.e. T, P, I.P.By the way the star divided in the different class was only based on their colors or can say temperature. The Harvard group of astrophysicists made a huge catalogue of star based on their colors and temperature is call Henry-Draper catalogue or (HD) catalogue. It contains details of more than 40,000 stars. The stars classified in W(WC &WN), O,B,A,F,G,R,N,K,S,M classes and each class have 10 subclasses like B0,B1….B9. It is given is table.Spectral type Temperature Color Spectral features RemarksO5-O9 40,000K-25,000K Blue – White Emission lines of He II and O II. Absorption lines of He II, He I, O II, Si IV, N III, and C III is dominant. H I is weak No star found earlier O5B0-B9 25,000K-11000K Blue – White Absorption lines of He I dominant. H II, O II are strong Some stars in OrionA0-A9 11000K-7500K White H II is very strong. Ca II is weaker Vega, Sirius, AltairF0-F9 7600K-6000K White-Yellow H II is weak. Ca II is strong. ProcyonG0-G9 6000K-5000K Yellow H II is weak. Ca II is at maximum strength. Sun, CapellaK0-K9 5100K-3500K Deep yellow-orange H II is very weak. Neutral metal lines are strong Arcturus, AldebranM0-M5 3600K-3000K Red H II is not present. Neutral metal lines are at maximum strength. Betelgeuse, AntaresR(C) 3000K Red C2, CN and TiO bands Carbon starsN(C) 3000K Red C2, CN and TiO bands Carbon StarsS 3000K Red C2, CN and TiO bands –The Image attached shows that Gauss sum fit of standard ESO data for a0i and g2v stars, where peak resides (shifted) for as per their color & temperature.Fitting using MagicPlotpro.CheersCepheid’s Observatory, RBT, India