Photometry: RR Lyrae/V* RR Lyr

RR Lyrae variables are old, low-mass, radially pulsating stars with periods in the range between 0.2 and 1 day. They are a numerous class of variable stars that populate galactic halos, thick disks and globular clusters. In the H-R diagram, RR Lyrae stars can be found in the narrow region where the horizontal branch intersects the pulsational instability strip. Their relatively small range of absolute mean magnitudes (because they lie on the horizontal branch) makes them important distance indicators in both our own Galaxy and those nearby. RR Lyrae stars are also excellent tracers of the chemical and dynamical properties of the oldest observable population of stars, so they give us insight into the earliest history of galaxies. Taking into account the pulsation modes, RR Lyrae stars can be divided into fundamental-mode (commonly referred to as RRab stars, sometimes called RR0 stars), first-overtone (RRc or RR1 stars) and double-mode (RRd or RR01 stars) pulsators. The existence of second-overtone pulsators among RR Lyrae variables (RRe or RR2 stars) is a matter of controversy. https://ogle.astrouw.edu.pl/atlas/RR_Lyr.html

Object: RR Lyrae
DATE-OBS: 2023-10-04T14:24:04.5960 + 2 Days
EXPTIME(Hrs): 5.64
SUBFRMS: 451
OBJCTRA: 19 25 27.872
OBJCTDEC: +42 46 59.05
Binning: 1 X 1
Plate Scale: 1.53″ /Pixel
Orientation: North UP/ East Left
Catalogs & Filter Magnitude Results:
Astrometry Catalog: ATLAS
Photometry Catalog: ATLAS
Imaging Filter: CLEAR
Photometry Mag: +7.6 R
Instruments:
CCD: ICX694M (4.5µm x 4.5µm)
TELESCOPE: 132MM APO, 610mm
PRiSMv11, Tycho10.8.4, Maxim DL
Site:
ORIGIN: Cepheid Observatory, India
SITELAT: +24:55:00:00
SITELONG:+75:33:58:99
Observers:
Cepheid Observatory
Remark:
Sky Clear

Note: The observations is done partially for 3 days, as object was visible for few hours in every night. The RR Lyrae have period of 0.56689 days and some of portions of possible maxima and minima covered. The exercise is done for learning and interest. https://browse.arxiv.org/pdf/astro-ph/0601432.pdf

Spectroscopy: W Ori & BL Ori Carbon stars in Orion “The Hunter”

We examine the optical spectrum of two carbon stars in Orion constellation. 4056Å C3 complex (STRONG in comets), 4217Å CN, 4380Å C2 Swan, 4738Å C2 Swan, 5165Å C2 Swan (STRONG), 5635Å C2 Swan, 6122Å C2 Swan, 4554Å BaII, 4607Å SrI Also look for the SiC2 bands at 4581Å, 4640Å, 4867Å, 4906Å, 4977Å.

Spectrum: VY Uma (Carbon Star)

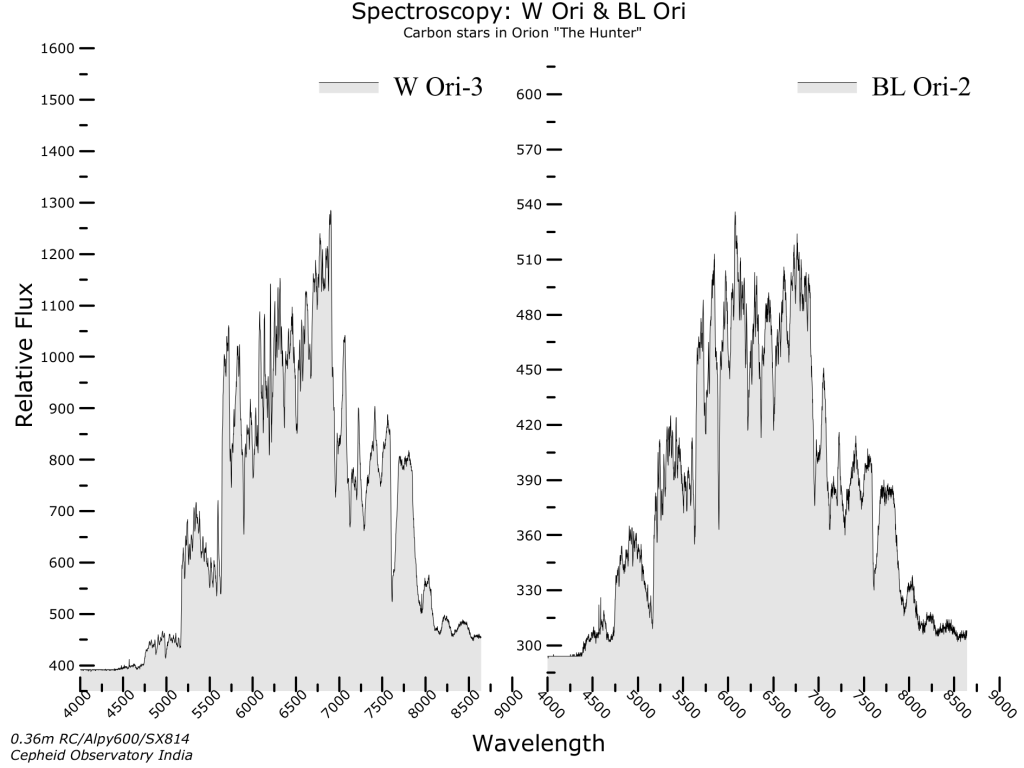
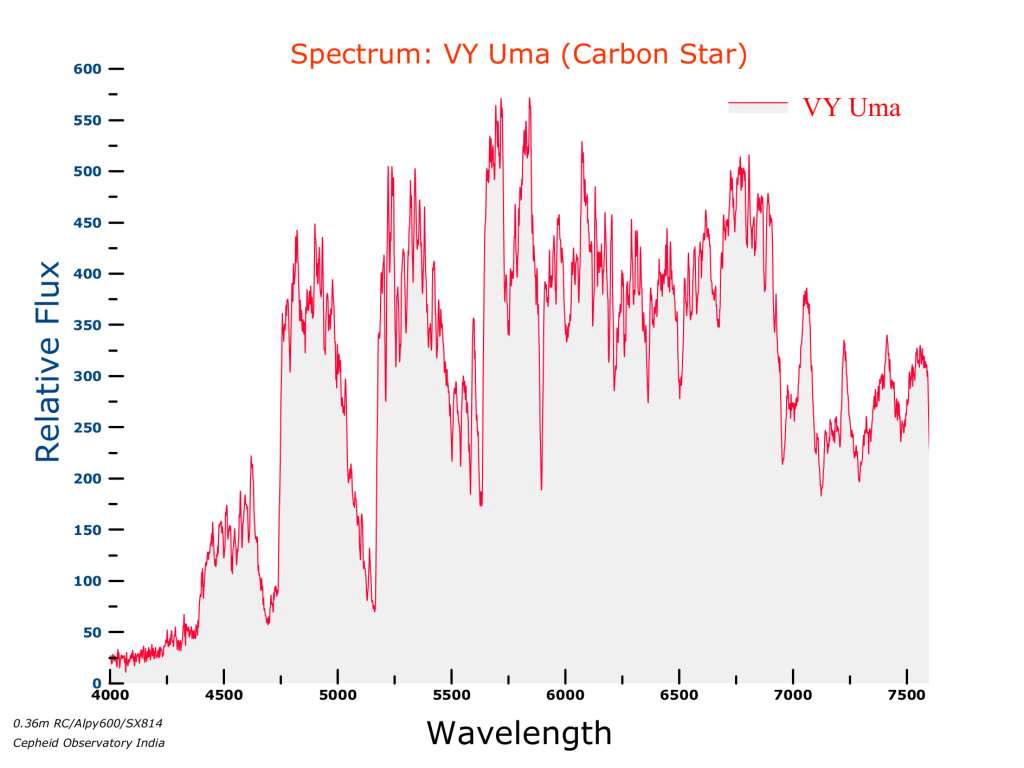
Carbon stars are typically evolved cool giants with some circumstellar material in the form of shells, soot, disks, or clouds. Carbon compounds are present in the photosphere after a star enters the red-giant evolutionary phase, when heavy elements (such as carbon) are dredged up from the stellar interior. For carbon features to form in the stellar photosphere, the C/O ratio is > 1, where C and O are the number of carbon and oxygen atoms present in the star. The C2 Swan bands are the dominate optical spectral features. Other strong features include C3, CN, CH, SiC2, CaII and there is often a strong NaD line.

Classical carbon stars are classified into the N and R series, where the N series stars are older stars that show s-process element (Ba, Sr) enhancement over the R stars. The CH stars are high-velocity Population II halo carbon stars, with enriched CH. An abundance index of C2 is also needed to describe a measure of excess carbon over oxygen. C2x, where x indicates increasing band strength from 1 to 8.
Another classification scheme (Yamashita 1975) uses designations for temperature and carbon band strength, such as C7,3. The first number indicates decreasing temperature from 0 to 9, as is the standard scheme for other spectral types. The second number indicates increasing strength of the carbon bands, from 1 to 5.

Some presumed giant C stars were seen to have high proper motions, and coupled with low luminosity, were determined to be the elusive dwarf carbon (dC) star. See Paul Green’s excellent papers on the dC’s.

RCrB and HdC stars are hydrogen deficient supergiant carbon stars. They likely formed from giants that have shed ALL of their hydrogen in the AGB stage, or were possibly created from the merger of white dwarfs. RCrB stars are variable due to circumstellar clouds of sooty carbon grains, and from pulsations(?), whereas typical HdC stars are not variable. These stars have unusual optical spectra, but will show weak CH and Balmer hydrogen lines, and strong HeI emission. These stars recently experienced a final He-shell flash.
Examples include RCrB, RYSgr, XXCam, MVSgr, DYPer, and HD182040 (non-variable).

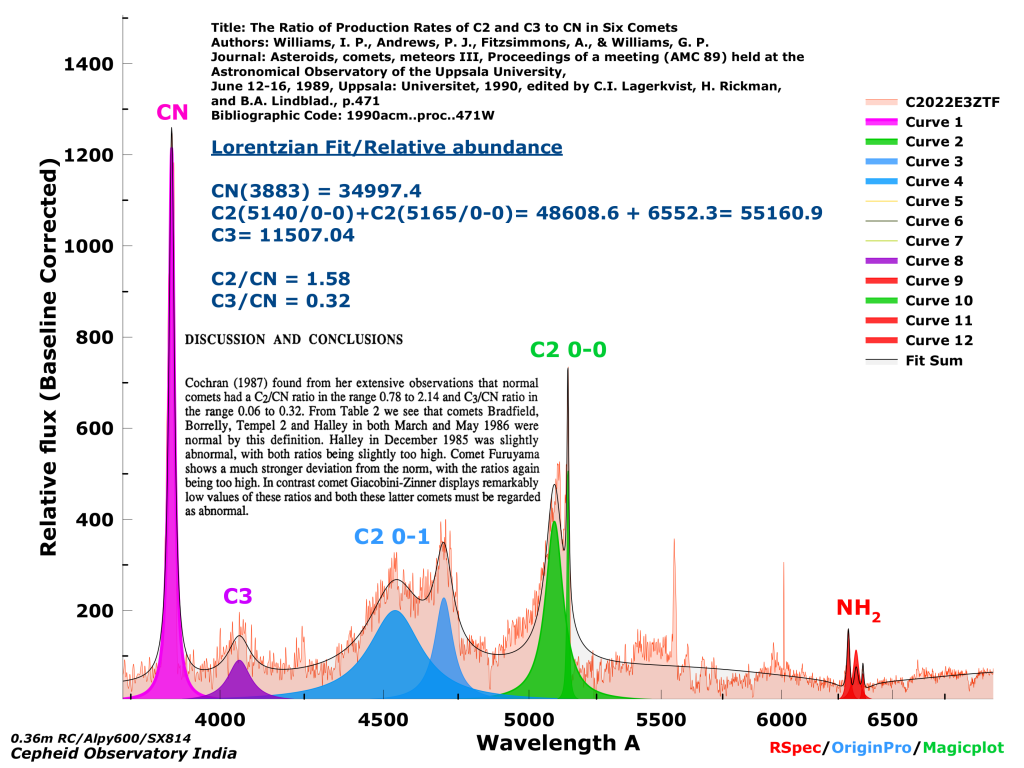
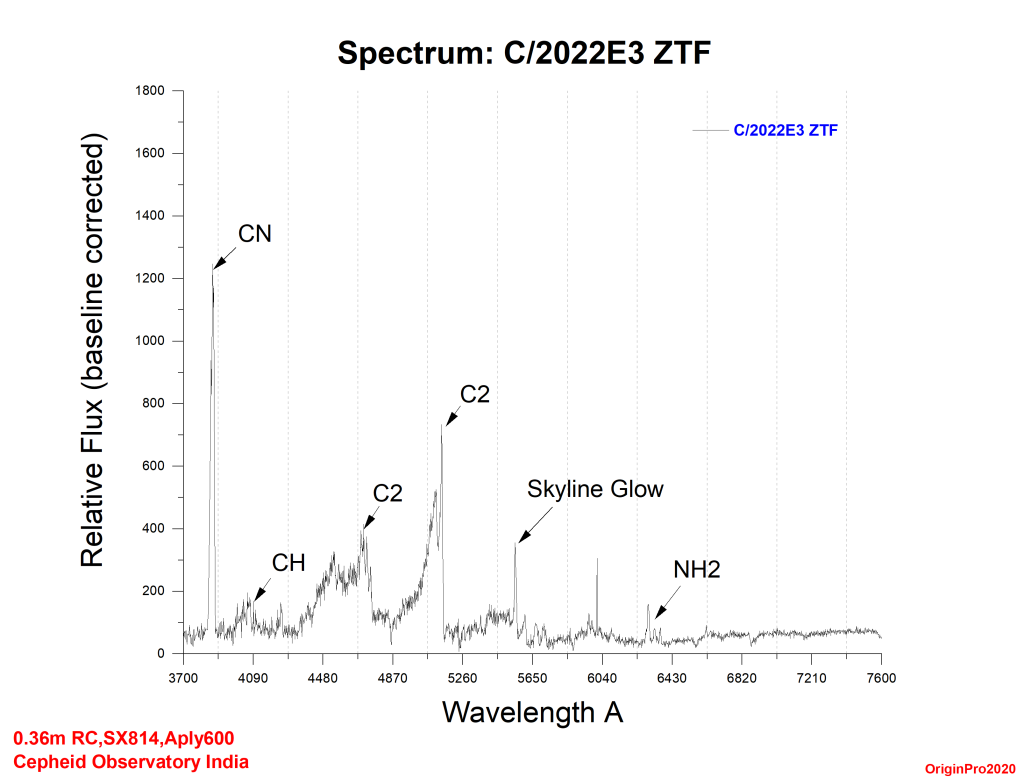
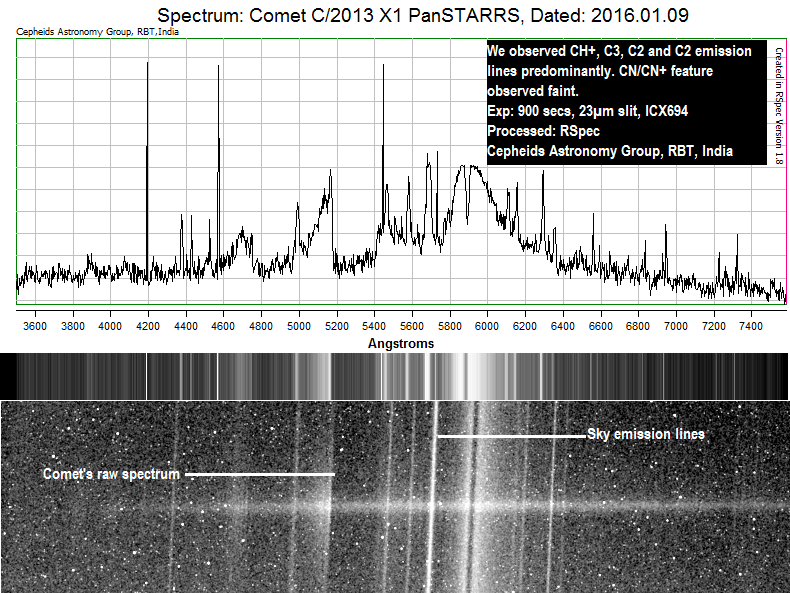
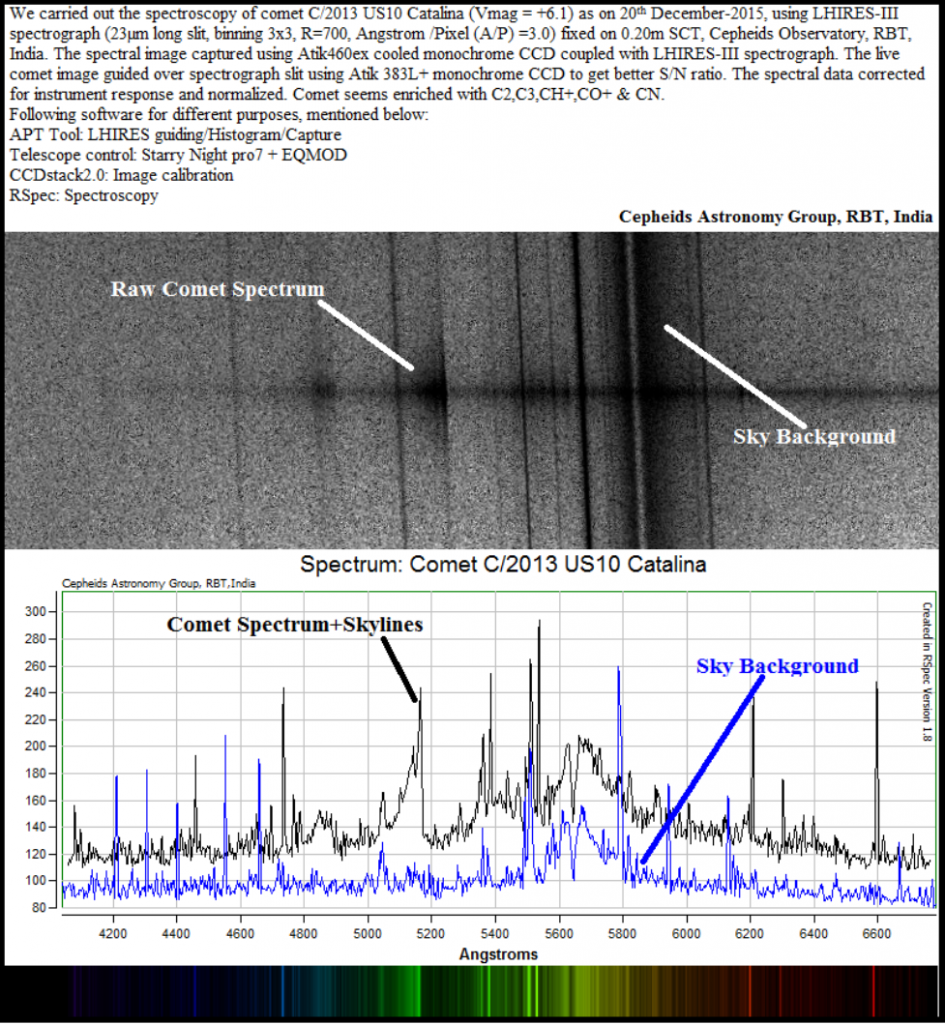
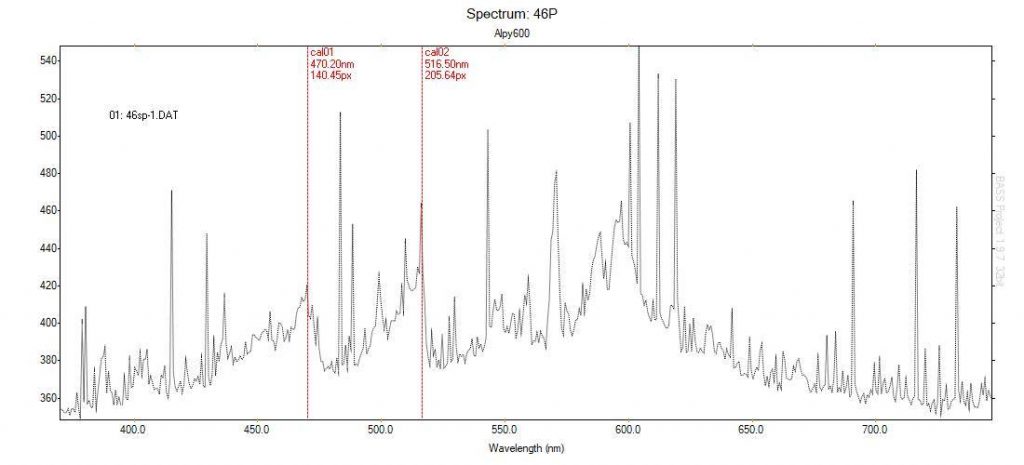
Carbon features also make an appearance in the DQ class of white dwarfs, and carbon features are common in the spectra of comets.

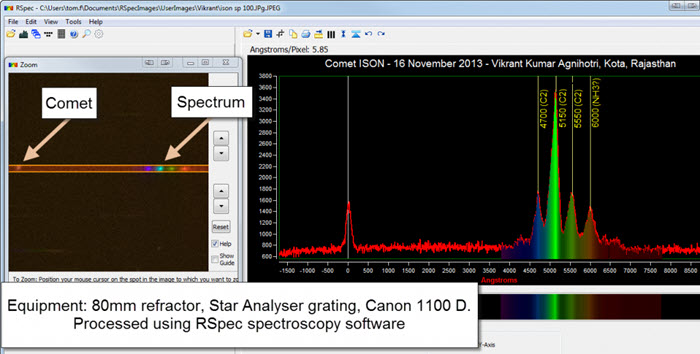
Some of my favorite carbon star features include (in Angstroms): 3880Å CN (STRONG in comets), 4056Å C3 complex (STRONG in comets), 4217Å CN, 4380Å C2 Swan, 4738Å C2 Swan, 5165Å C2 Swan (STRONG), 5635Å C2 Swan, 6122Å C2 Swan, 4554Å BaII, 4607Å SrI
Also look for the SiC2 bands at 4581Å, 4640Å, 4867Å, 4906Å, 4977Å.

Note that the molecular carbon bands have a reverse profile than that of TiO, that is the carbon bands start with a sharp bandhead edge at the red end of the band and then taper off towards the blue. (With an exception of the SiC2 bands, which taper off towards the red!)

Credit: https://lweb.cfa.harvard.edu/~pberlind/atlas/htmls/cstars.html

https://lweb.cfa.harvard.edu/~pberlind/atlas/htmls/carboncat.html

Relative abundance of C2/C3/CN in comet C/2022E3 ZTF

We carried out the spectroscopy of comet C/2022E3 ZTF (V mag = +5.7) as on 28th January-2023, using Aply600 spectrograph (23µm long slit, R=700, Angstrom /Pixel (A/P) =1.9) fixed on 0.36m RC. The spectral image captured using SX814 cooled monochrome CCD coupled with Aply600 spectrograph. The image guided over spectrograph slit using Atik 414 monochrome CCD to get better S/N ratio. Comet seems enriched with C2,CH+,NH2 & CN.

The spectral data corrected for instrument response and baseline corrected. We used RSpec and OriginPro2020 for data analysis.

We tried to estimate the relative abundance of C2/C3/CN in comet C/2022E3 ZTF using Lorentz fitting. The area of respective peaks are calculated for C2/C3/CN, We find the results as follows. Figure attached.

Lorentzian Fit/Relative abundance

CN(3883) = 34997.4
C2(5140/0-0)+C2(5165/0-0)= 48608.6 + 6552.3= 55160.9
C3= 11507.04

C2/CN = 1.58
C3/CN = 0.32

The link of supported document / paper is given below.

Title: The Ratio of Production Rates of C2 and C3 to CN in Six Comets
Authors: Williams, I. P., Andrews, P. J., Fitzsimmons, A., & Williams, G. P.
Journal: Asteroids, comets, meteors III, Proceedings of a meeting (AMC 89) held at the
Astronomical Observatory of the Uppsala University,
June 12-16, 1989, Uppsala: Universitet, 1990, edited by C.I. Lagerkvist, H. Rickman,
and B.A. Lindblad., p.471
Bibliographic Code: 1990acm..proc..471W

Spectrum: C/2022E3 ZTF

We carried out the spectroscopy of comeC/2022E3 ZTF (Vmag = +5.7) as on 28th January-2023, using Aplt600 spectrograph (23µm long slit, R=700, Angstrom /Pixel (A/P) =1.9) fixed on 0.36m RC. The spectral image captured using SX814 cooled monochrome CCD coupled with Aply600 spectrograph. The image guided over spectrograph slit using Atik 414 monochrome CCD to get better S/N ratio. Comet seems enriched with C2,CH+,NH2 & CN.
The spectral data corrected for instrument response and baseline corrected. We used RSpec and OriginPro2020 for data analysis.
Cepheids Observatory India

Spectrum: Comet ISON

The spectrum below of the comet ISON shows how easy it is for amateurs to study astronomical spectra. This wonderful spectrum of ISON using a just an 80 mm refractor, simple Star Analyser grating, and a DSLR. It clearly shows the green glow from glowing Carbon (the so-called “Swan bands” – Wikipedia link) This image was captured from a rooftop in Rajasthan, and then processed in the RSpec software.

Comet C/2013 X1 PanSTARRS

We carried out the spectroscopy of Comet C/2013 X1 PanSTARRS (Vmag = +9.67) as on 2016.01.09, using LHIRES-III spectrograph (23µm long slit, R=700, Angstrom /Pixel (A/P) =3.0) fixed on 0.20m SCT. The spectral image captured using Atik460ex cooled monochrome CCD coupled with LHIRES-III spectrograph. The image guided over spectrograph slit using Atik 383L+ monochrome CCD to get better S/N ratio. Comet seems enriched with C2,C2,CH+ & CN.
The spectral data corrected for instrument response and normalized. We used following software for different purposes.
APT Tool: LHIRES guiding/Histogram/Capture
Telescope control: Starry Night pro7 + EQMOD
CCDstack2.0: Image calibration
RSpec: Spectroscopy
Cepheids Astronomy Group, RBT, India.

Comet C/2013 US10 Catalina

We carried out the spectroscopy of comet C/2013 US10 Catalina (Vmag = +6.1) as on 20th December-2015, using LHIRES-III spectrograph (23µm long slit, R=700, Angstrom /Pixel (A/P) =3.0) fixed on 0.20m SCT. The spectral image captured using Atik460ex cooled monochrome CCD coupled with LHIRES-III spectrograph. The image guided over spectrograph slit using Atik 383L+ monochrome CCD to get better S/N ratio. Comet seems enriched with C2,C2,CH+,CO+ & CN.
The spectral data corrected for instrument response and normalized. We used following software for different purposes.
APT Tool: LHIRES guiding/Histogram/Capture
Telescope control: Starry Night pro7 + EQMOD
CCDstack2.0: Image calibration
RSpec: Spectroscopy
Cepheids Astronomy Group, RBT, India.