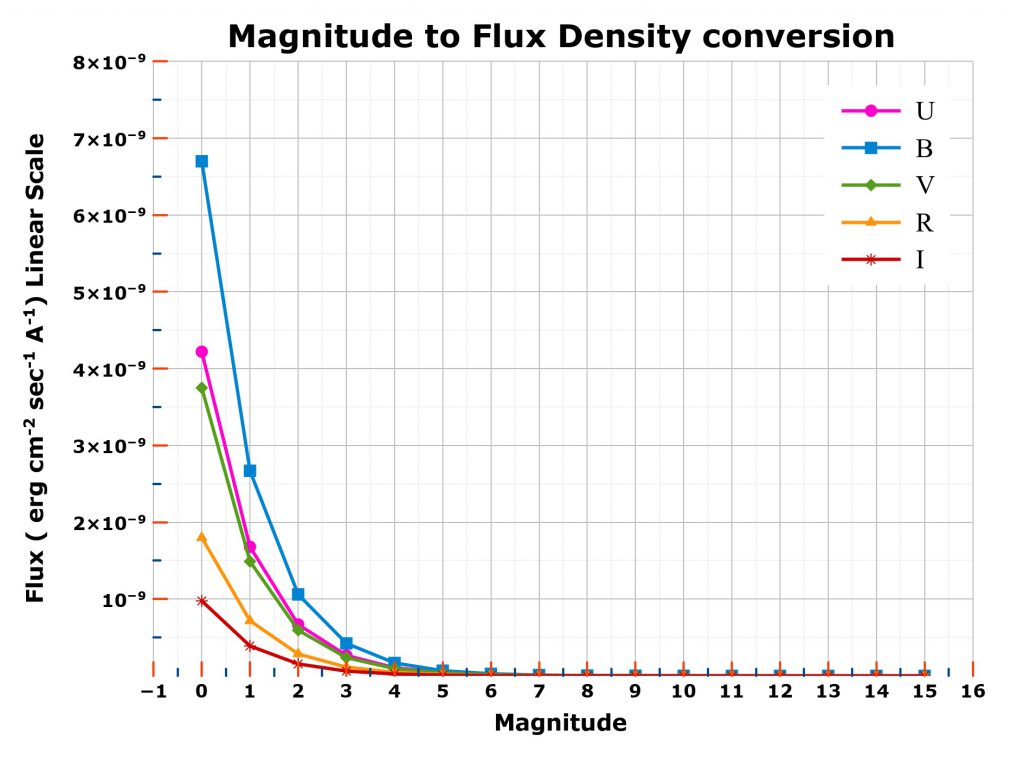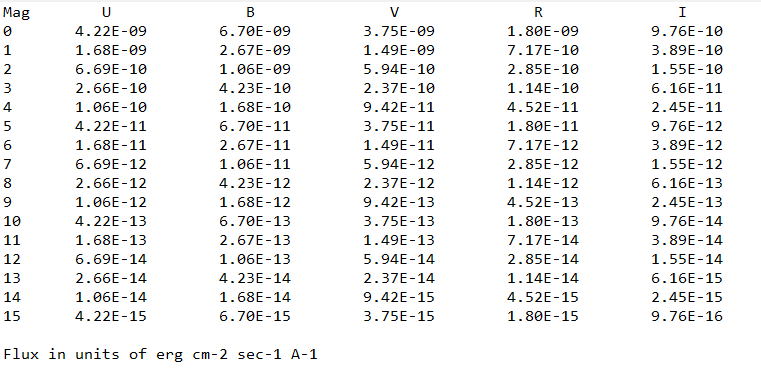
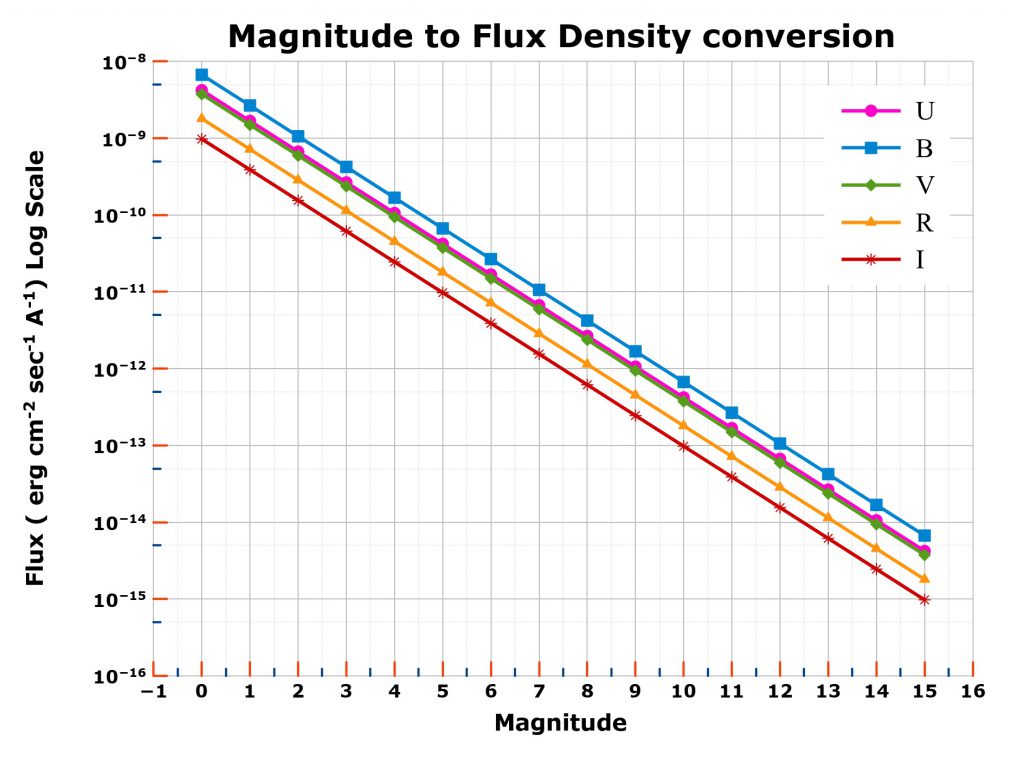
The following graphs shows the conversion of flux densities w.r.t. magnitudes. The magnitude range is selected based on UCAC4 catalog from 0 to +16. The Y axis represents the energy flux in the units of (erg cm-2 sec-1 A-1) w.r.t respective U B V R I magnitudes. The graphs plotted both in Log and Linear scales.
Log Scale:
Linear Scale: